
BNB Price Analysis: Bullish Momentum
BNB is on the move! The price of BNB has been making a strong attempt to push higher, aiming for the bullish trendline. This is the second time BNB has tried to break above the trendline, suggesting a positive shift in sentiment among traders.
Technical Analysis: Key Trendline and a Potential Rally
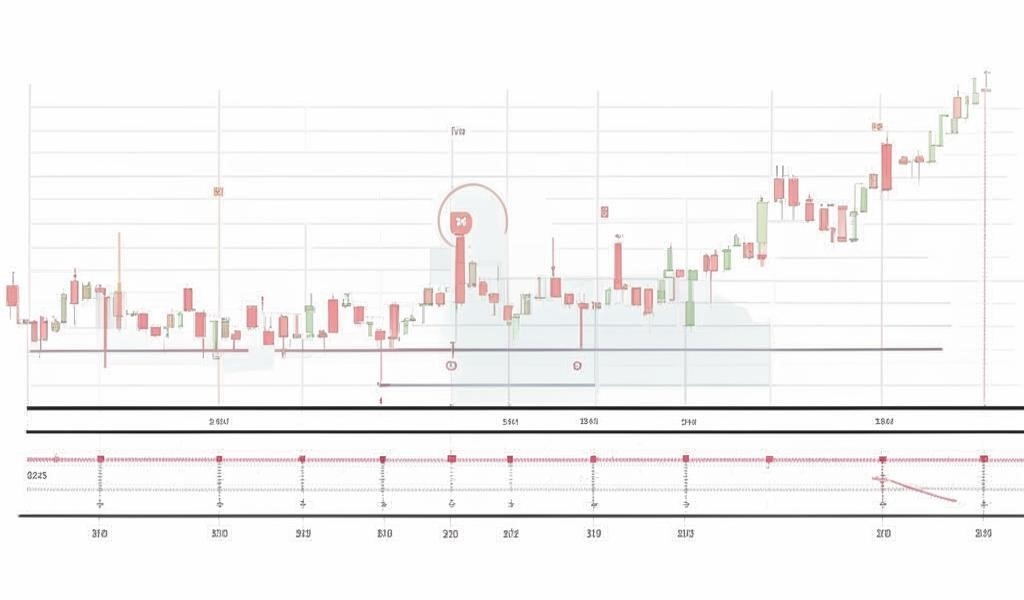
On the 4-hour chart, BNB is trading above the 100-day Simple Moving Average (SMA) and is showing a clear upward trajectory. The Composite Trend Oscillator indicates that BNB could maintain its momentum and target the $635 resistance level.
The 1-day chart also shows a bullish outlook. While BNB is still below the 100-day SMA, the growing momentum suggests that it could potentially break above the trendline and move towards the $635 resistance. The signal line has crossed above the SMA of the indicator, indicating potential for further price growth.
Future Outlook: What Lies Ahead for BNB?
BNB’s future direction depends heavily on its ability to break above the bullish trendline. If successful, a rally towards the $635 resistance level is highly likely. A break above this level could open the door for further gains, potentially reaching the $724 resistance level.
However, if BNB fails to break above the trendline and starts to fall, it could head towards the $500 support level. A break below this level could lead to a further decline towards the $357 support level.
It’s important to remember that the cryptocurrency market is volatile. Keep an eye on technical indicators and news events to stay informed about potential price movements.
You can learn more about BNB at Binance.com.


