
Ethereum’s Price Tango: A Look at the Recent Ups and Downs
Ethereum (ETH), the second largest cryptocurrency by market cap, has been on a bit of a rollercoaster ride lately. Traders and investors are cautiously optimistic, but the recent volatility has them keeping a close eye on the price action.
Key Levels and Technicals
The past month has seen some crucial support and resistance levels emerge.
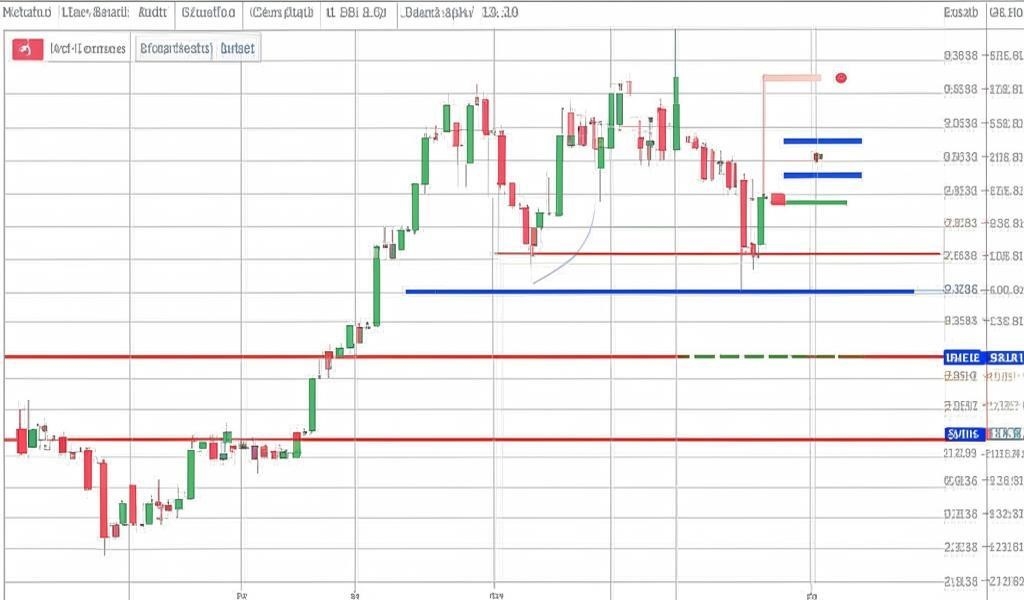
* **The 100-day Moving Average (MA)**: Ethereum briefly broke above this level at around $3,354, but a sell-off followed closely, hinting at a possible bull trap.
* **The 200-day MA**: A critical demand area for ETH for years, this level, at around $3,200, has acted as a support. A break below this level could signal a bearish trend towards the lower boundary of the multi-month wedge, around $2,800.
* **The 4-hour Chart**: Selling pressure has been evident around $3,500. A break below this level led to a quick drop towards the long-term declining trendline, suggesting retests of previous breakout points. Ethereum needs to find stability near $3,300 or beyond to break this pattern and avoid bearish pressures.
Sentiment and Market Factors
Sentiment surrounding Ethereum has been mixed. Expectations for a bullish push following ETH spot ETFs haven’t quite materialized, reflecting broader market hesitancy.
* **Trading Volume and Market Cap**: Increased activity is being seen, which could either drive a recovery or exacerbate corrections, depending on overall market conditions.
* **Fibonacci Retracement Levels**: ETH briefly touched the 23.6% Fibonacci retracement level, providing short-term support. However, the recovery from there has been weak, with ETH now facing resistance just below the 50% Fibonacci level of $3,455. These two levels will play a key role in determining whether ETH goes back to higher prices or faces further bearish pressure.
Looking Ahead
Ethereum’s future direction largely depends on its ability to maintain support above the $3,200 level. If this critical support holds, ETH could rise towards $3,500 again. However, broader market uncertainty and potential regulatory changes could significantly impact investor sentiment and price action.
* **Key Resistance Levels**: Breaking through the resistance levels at $3,300 and $3,400 could bring back bullish sentiment and potentially lead to retests of previous highs around $3,500.
* **Key Support Levels**: Breaking below key support levels could trigger further sell-offs, potentially leading to ETH finding support around $2,800.
**Remember**, the cryptocurrency market is volatile, and it’s important to do your own research and consider your own risk tolerance before making any investment decisions.


