
Shiba Inu Price Analysis: Bullish Breakout on the Horizon?
Shiba Inu (SHIB) has been making some interesting moves lately. The memecoin’s price has been consolidating in a bullish pattern since July 15th, and the NVT ratio has increased, suggesting a potential breakout.
Bullish Pattern and Indicators
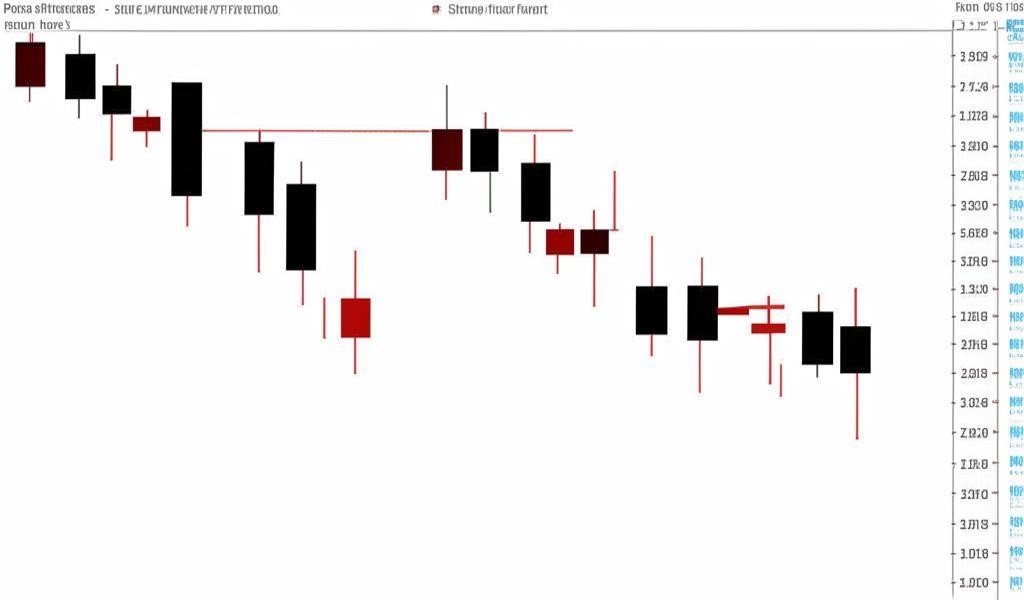
While SHIB’s weekly chart was red for the past seven days, the past 24 hours have seen a shift in trend. A bullish falling wedge pattern emerged on SHIB’s 12-hour chart, and a successful breakout could lead to a significant bull rally.
Here are some key indicators pointing towards a potential breakout:
* **Falling wedge pattern:** The falling wedge pattern suggests a bullish trend reversal.
* **Relative Strength Index (RSI):** The RSI has shown an uptick, indicating increasing buying pressure.
* **Chaikin Money Flow (CMF):** The CMF has also moved northwards, further supporting the possibility of a continued price rise.
Potential Price Targets
If SHIB breaks out of the falling wedge pattern, it could reach $0.00001933 in the coming week. A further rally could push the price to $0.0000259.
However, if the trend reverses, SHIB could drop to $0.000019 in the coming days.
What to Watch For
While the indicators are looking bullish, it’s important to remember that the cryptocurrency market is volatile. It’s crucial to stay informed and monitor the market closely.
You can keep up with Shiba Inu’s price action and developments on their website: [Link to Shiba Inu website].


